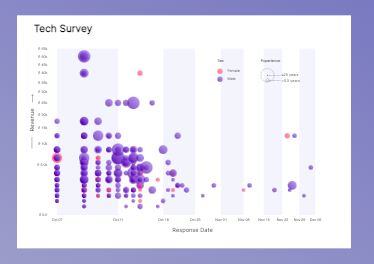
Visualizing responses through time.
I’ve visualized Tech Survey 2020 responses through time.
On the x axis I’ve used adjusted logarithmic scale in order to improve visibility.
Visualizing responses through time.
I’ve visualized Tech Survey 2020 responses through time.
On the x axis I’ve used adjusted logarithmic scale in order to improve visibility.
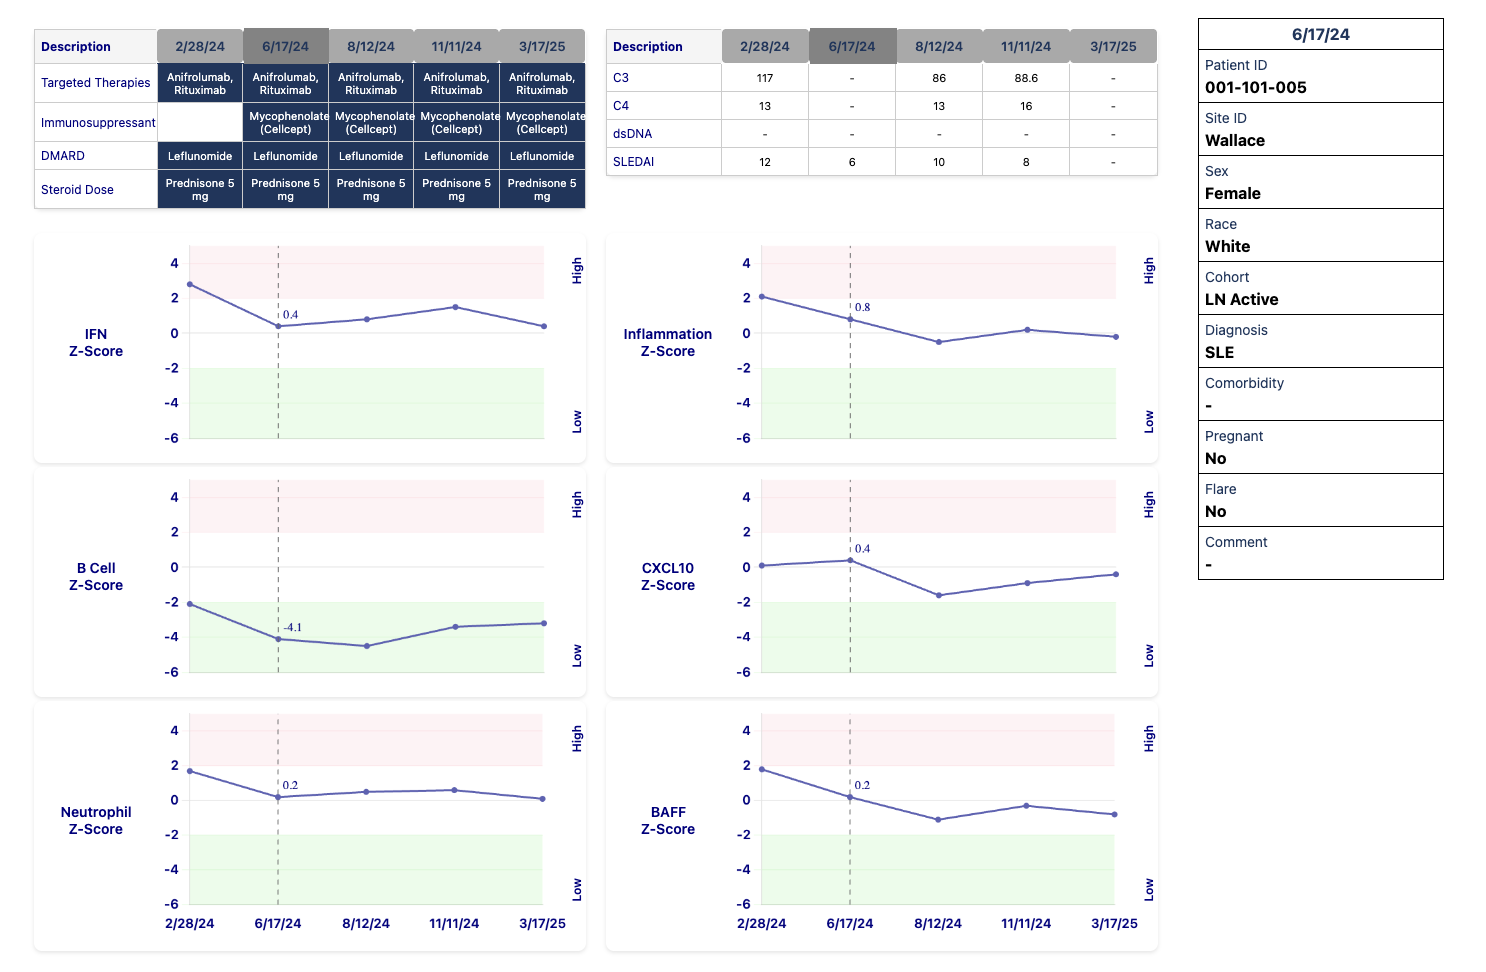
The dashboard visualizes treatment and its outcomes of the selected patient o...
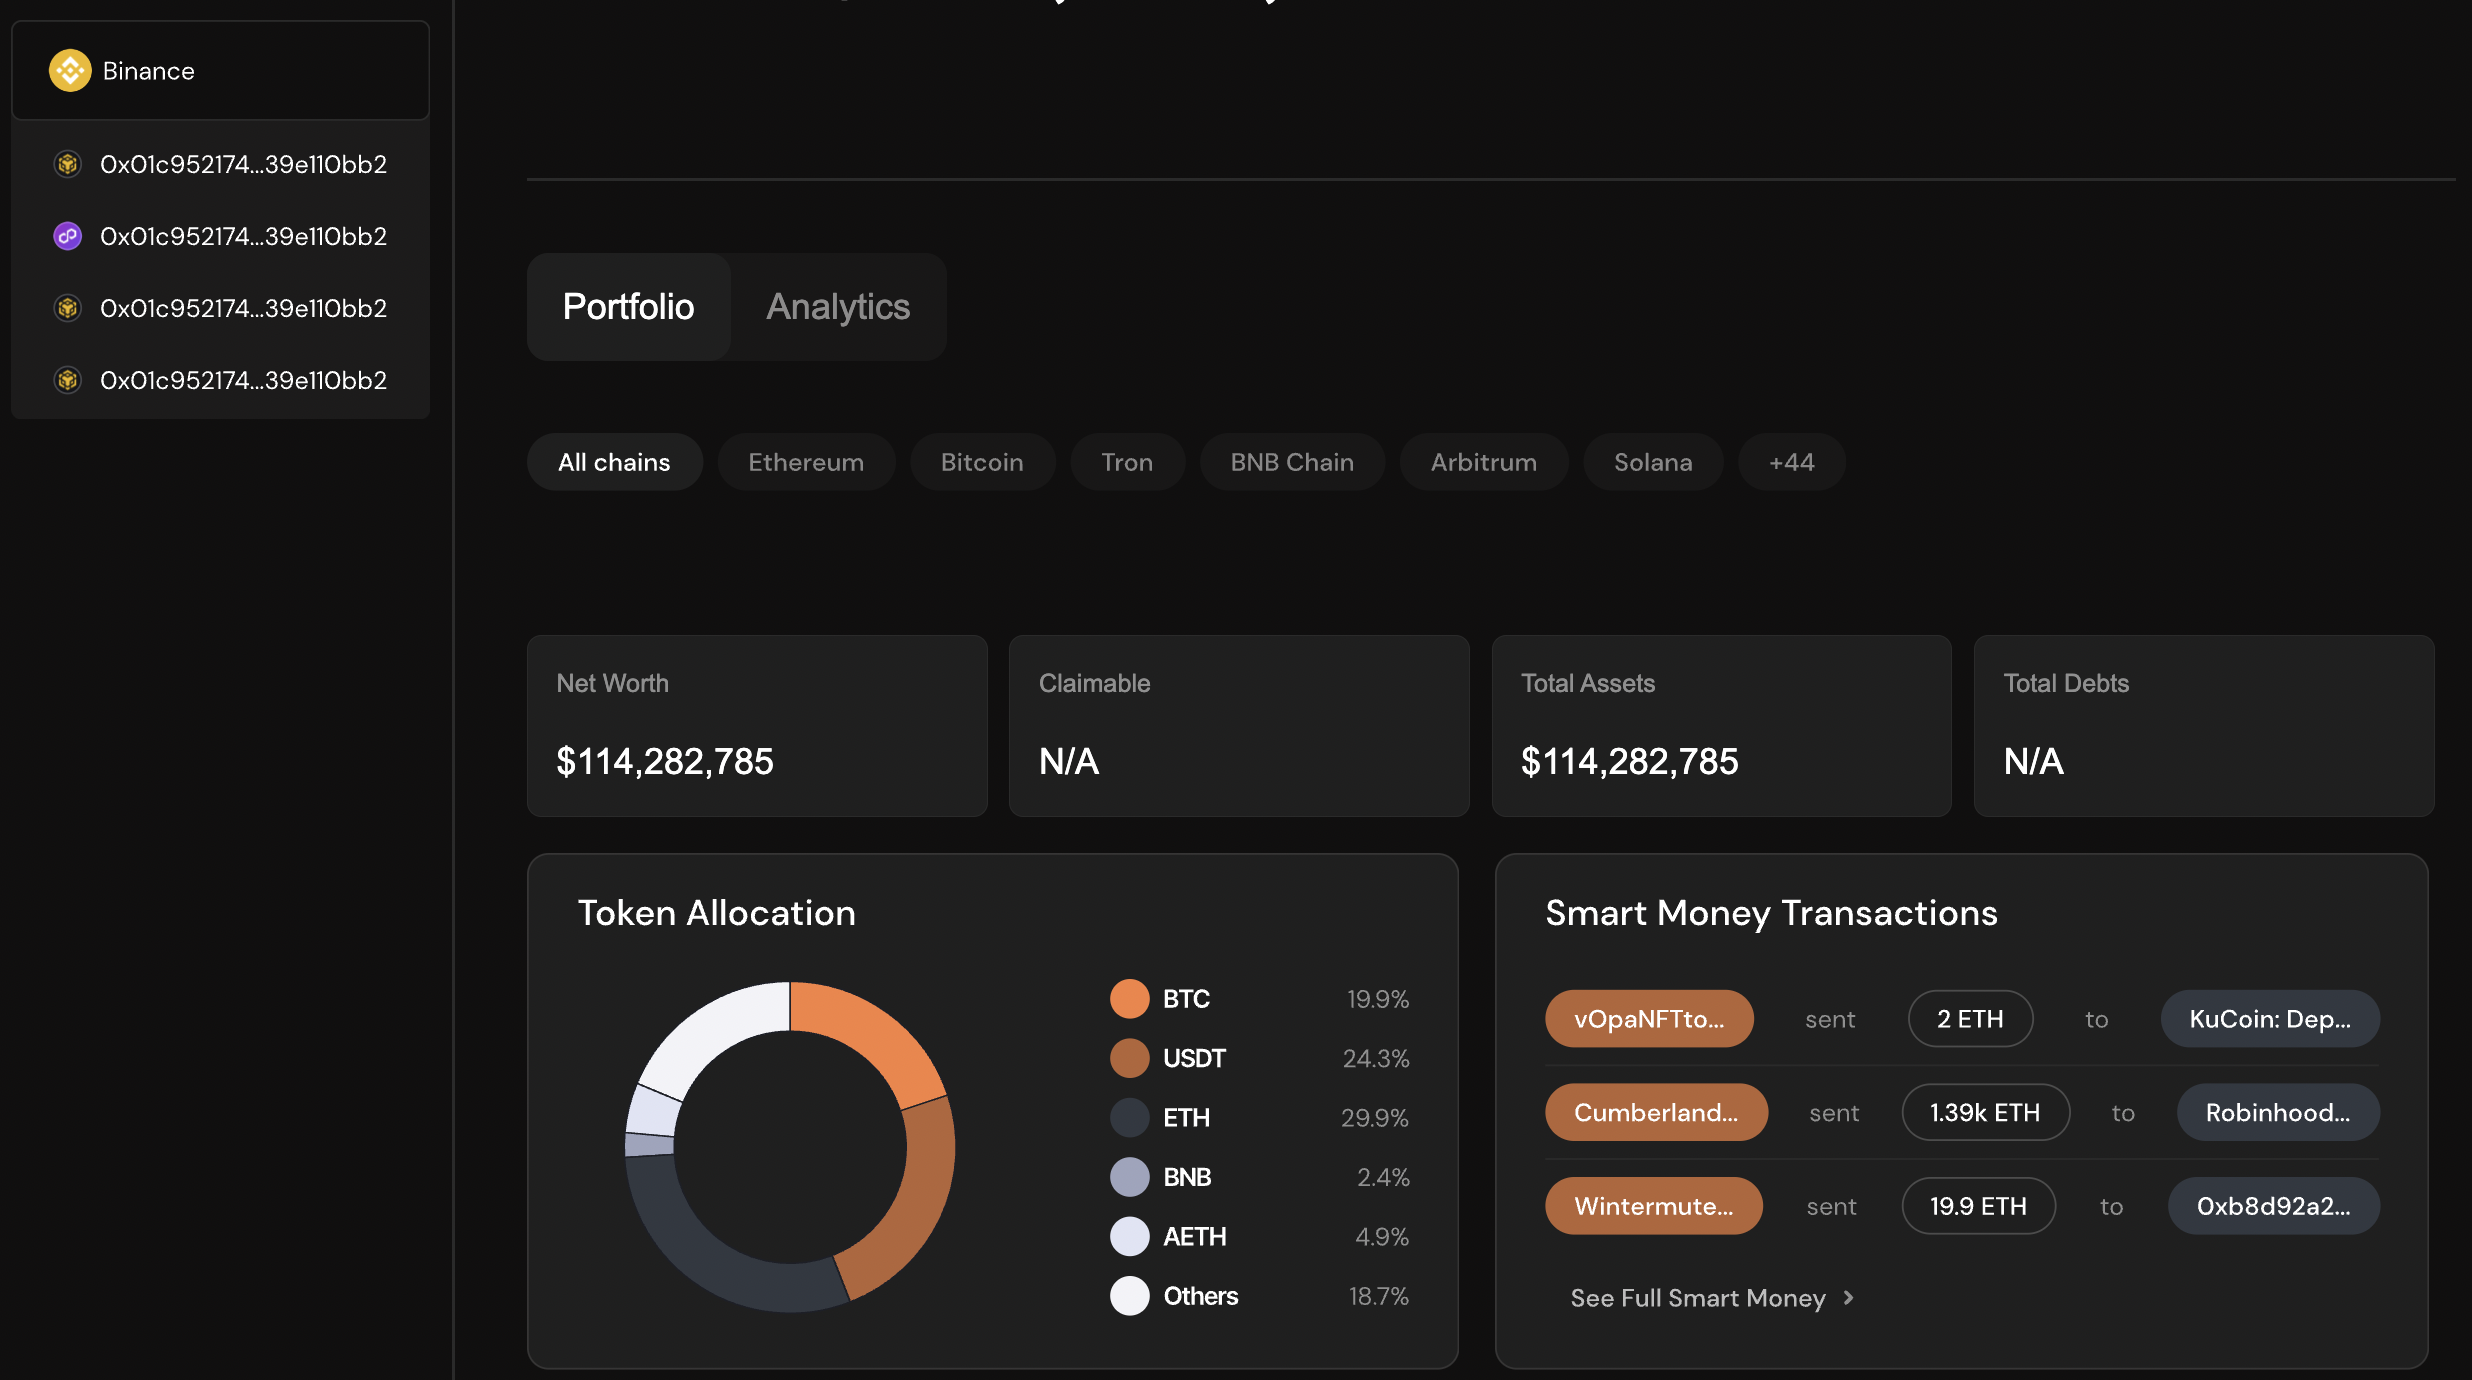
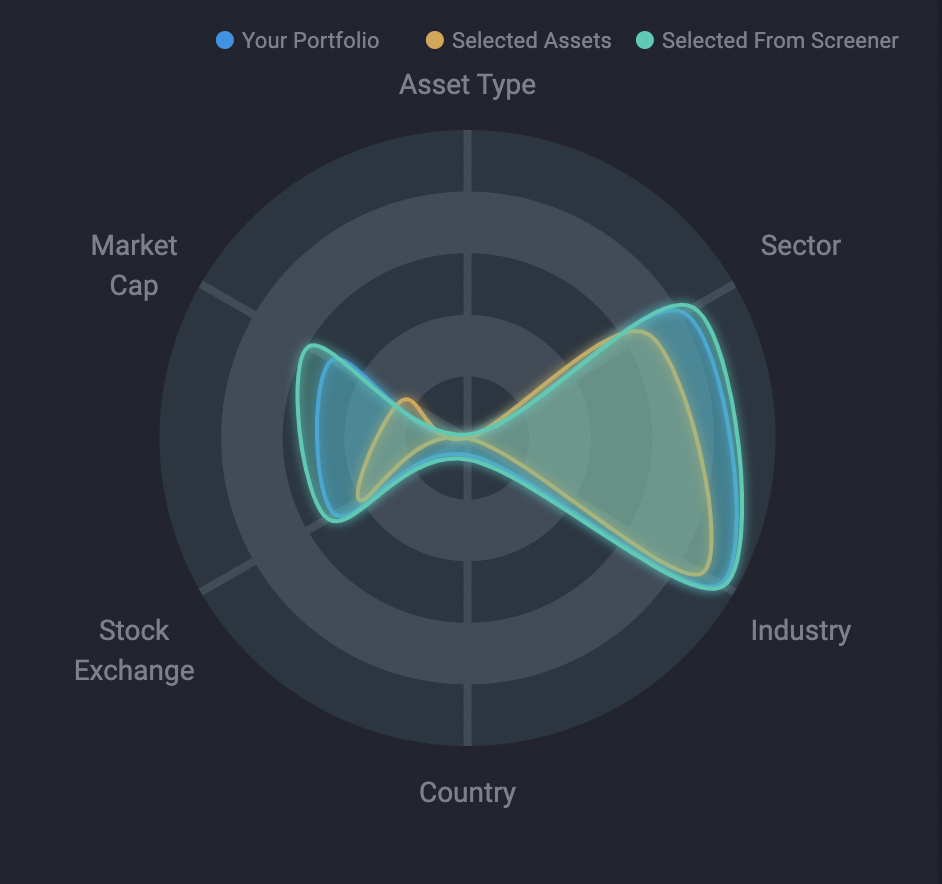
Website prototype with several pages and data visualization dashboards. ...
Charts Gallery