Overlapping vizualization of responses.

I’ve grouped data based on the experiences of the respodents and visualized their average monthly revenue as opposed to their deserved salary.


Overlapping vizualization of responses.
I’ve grouped data based on the experiences of the respodents and visualized their average monthly revenue as opposed to their deserved salary.
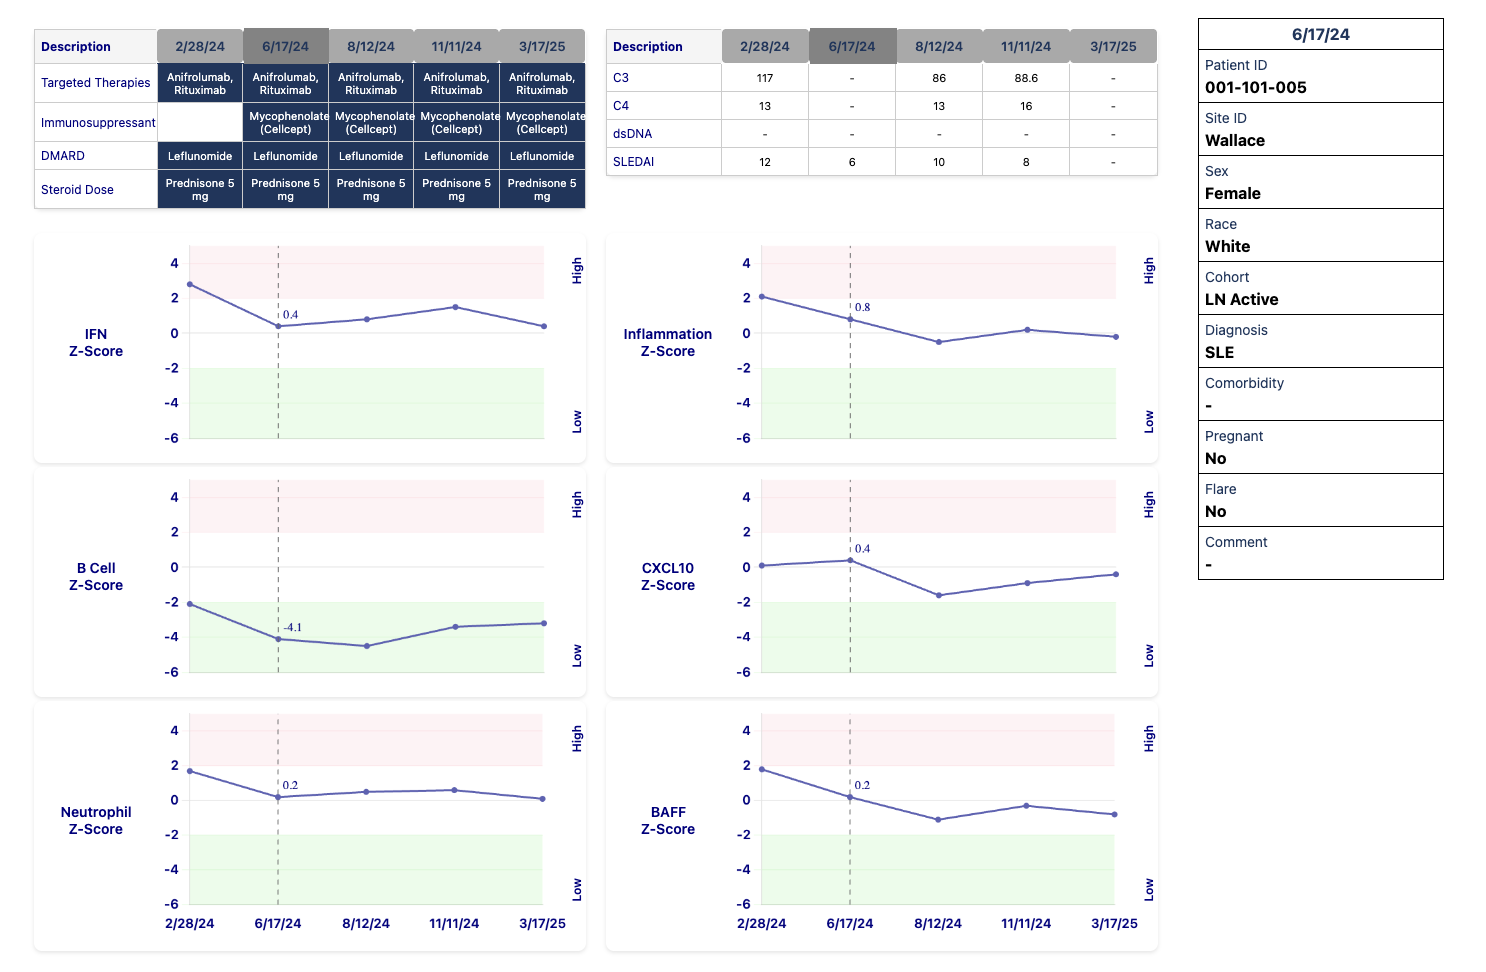
The dashboard visualizes treatment and its outcomes of the selected patient o...
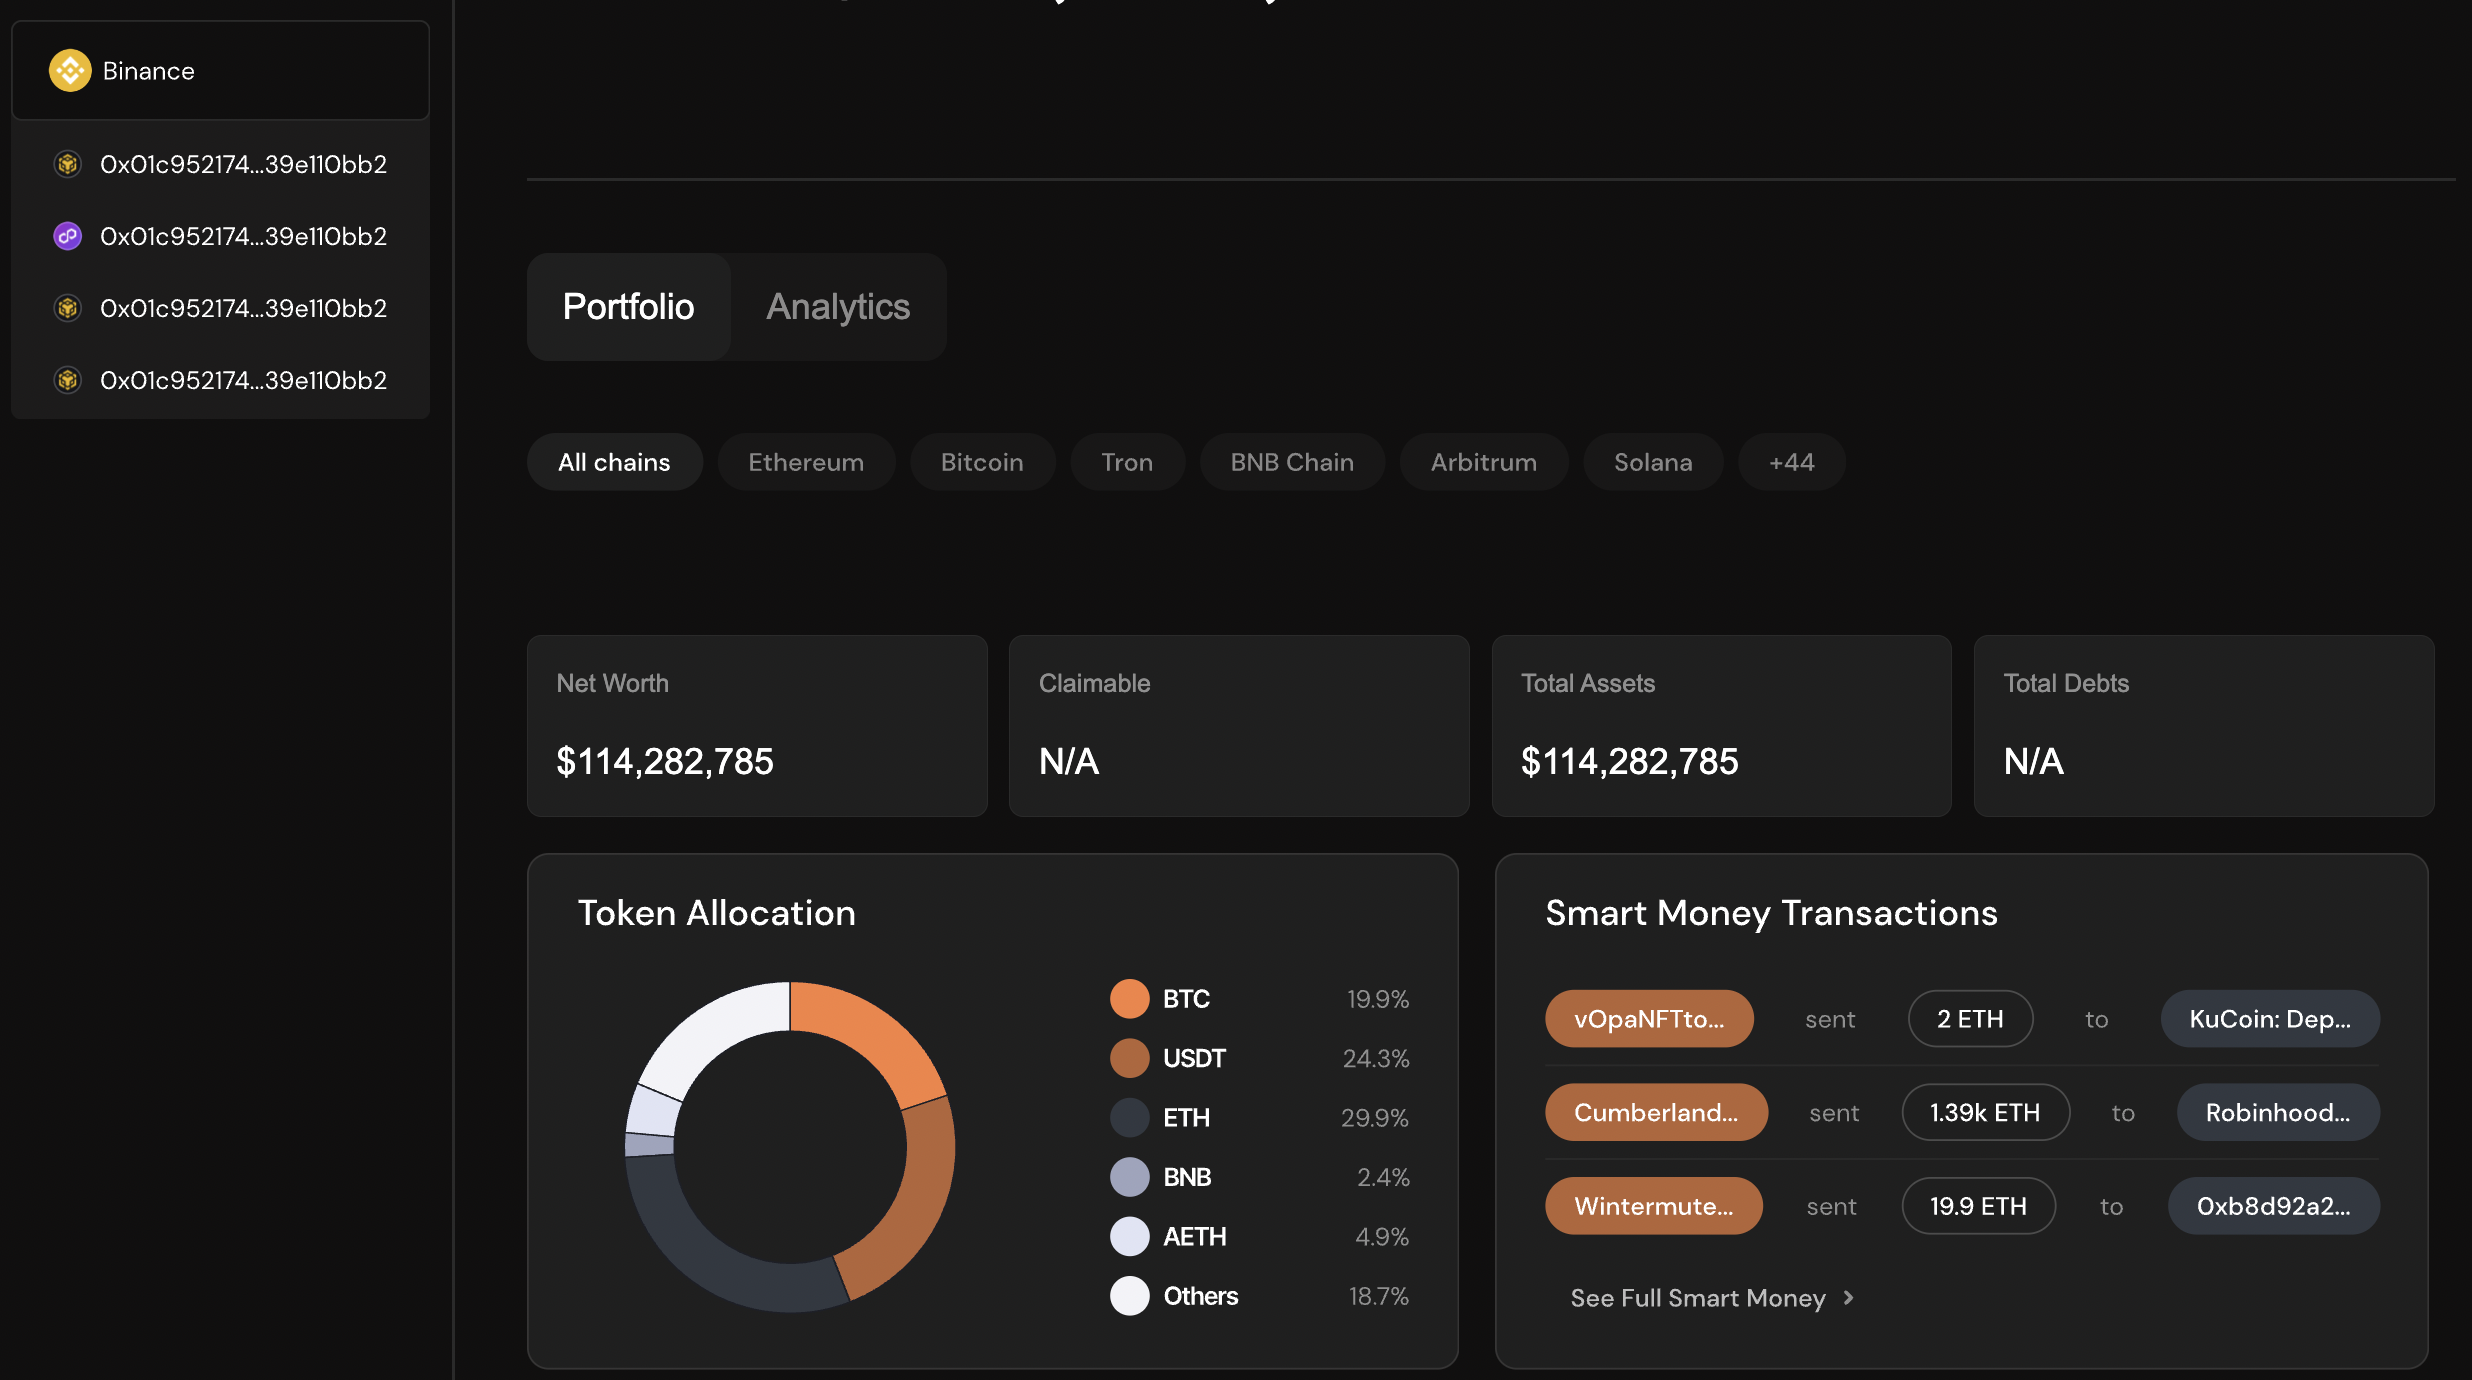
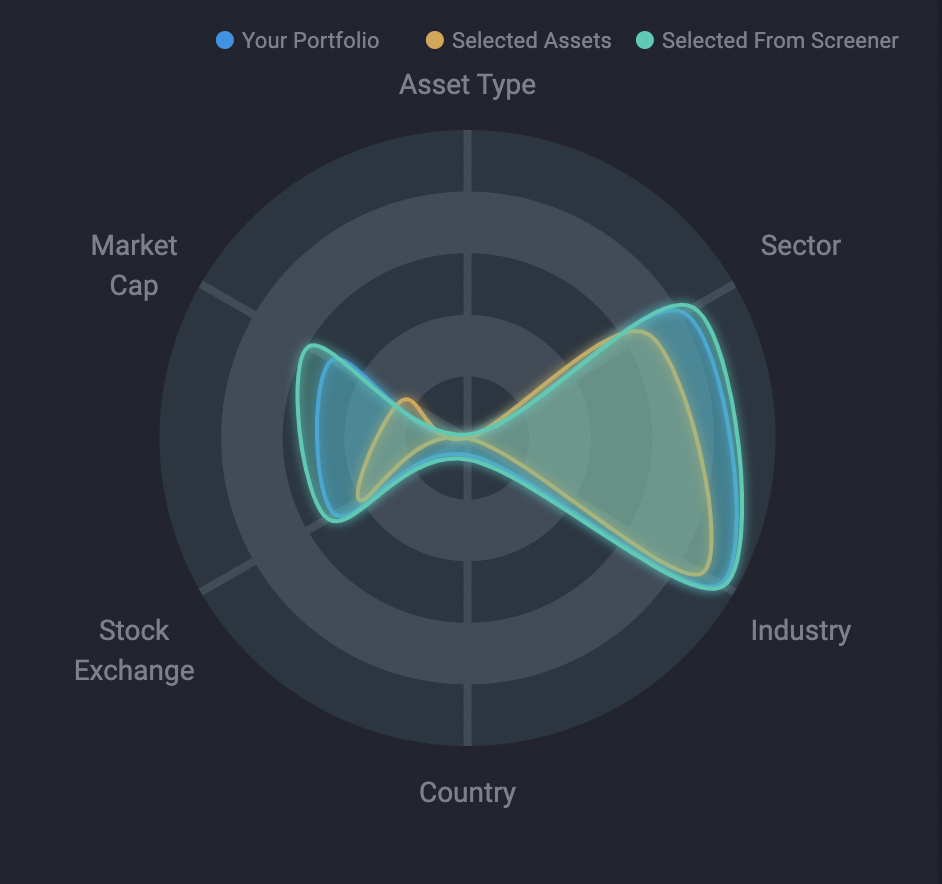
Website prototype with several pages and data visualization dashboards. ...
Charts Gallery