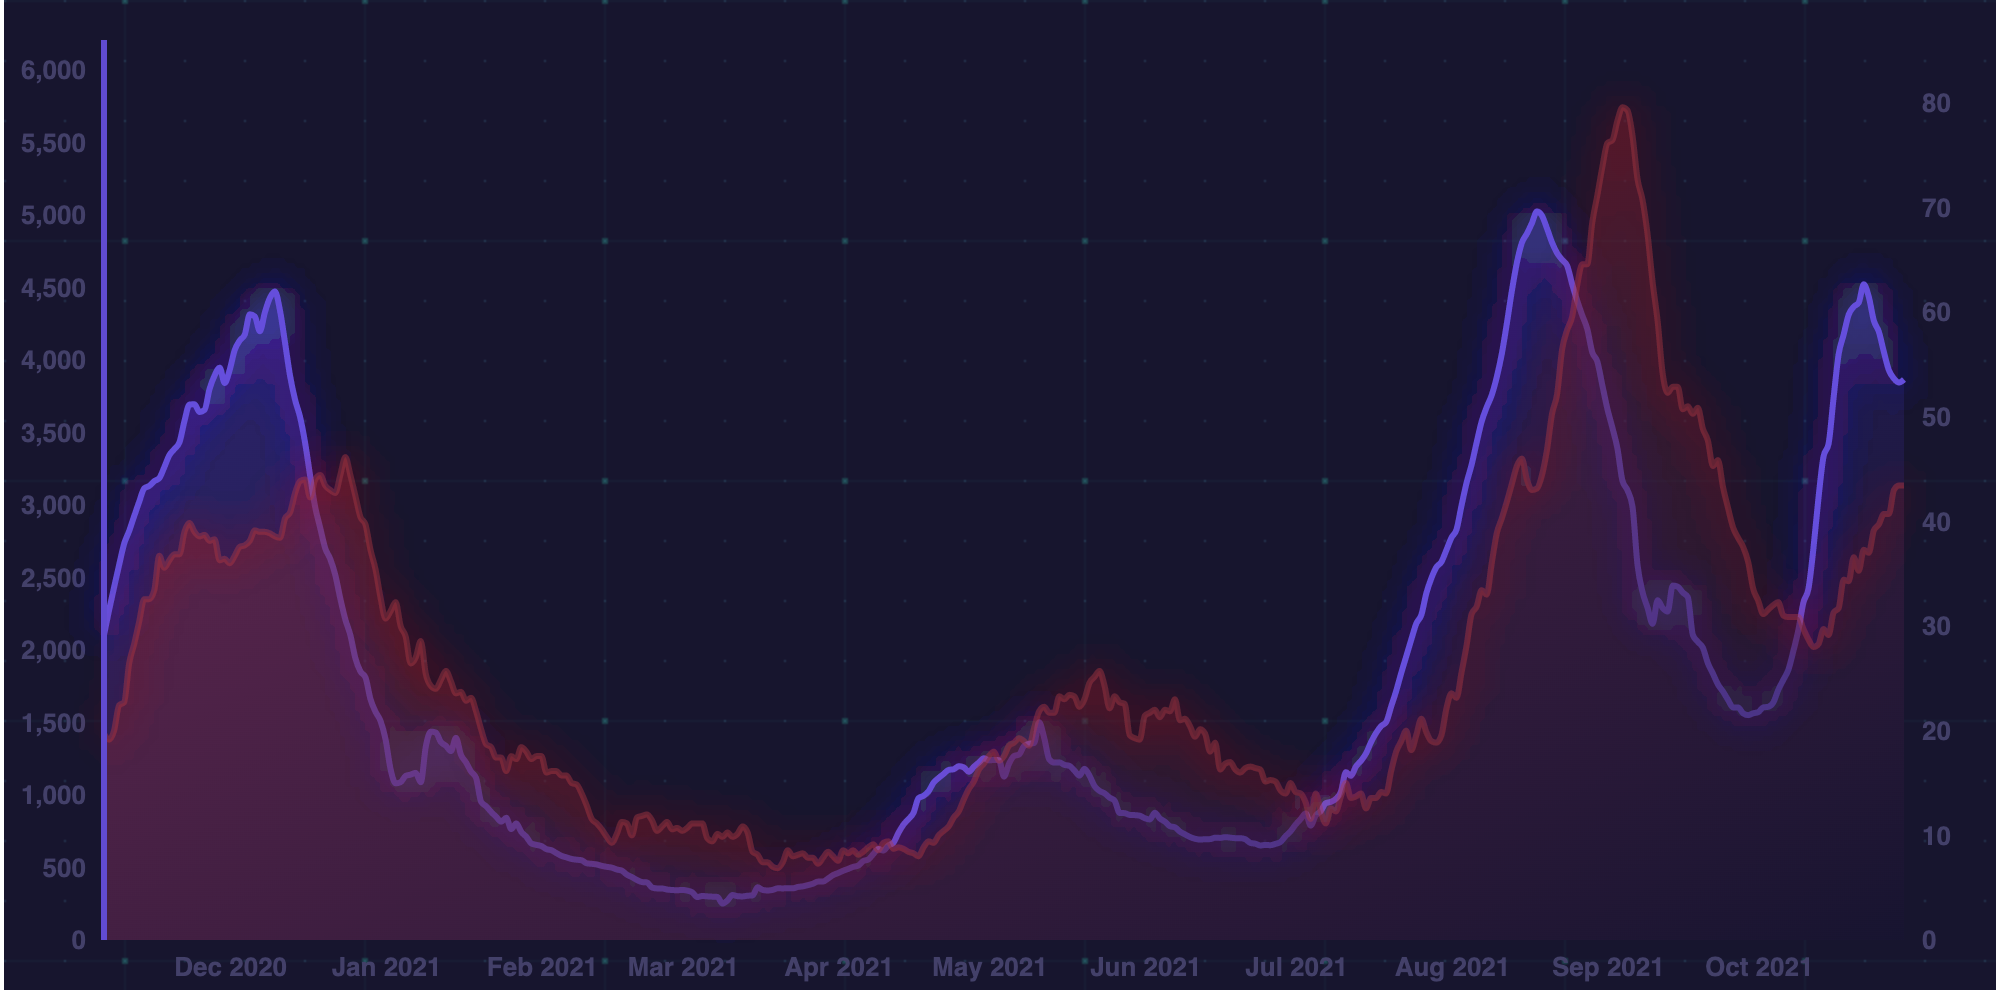
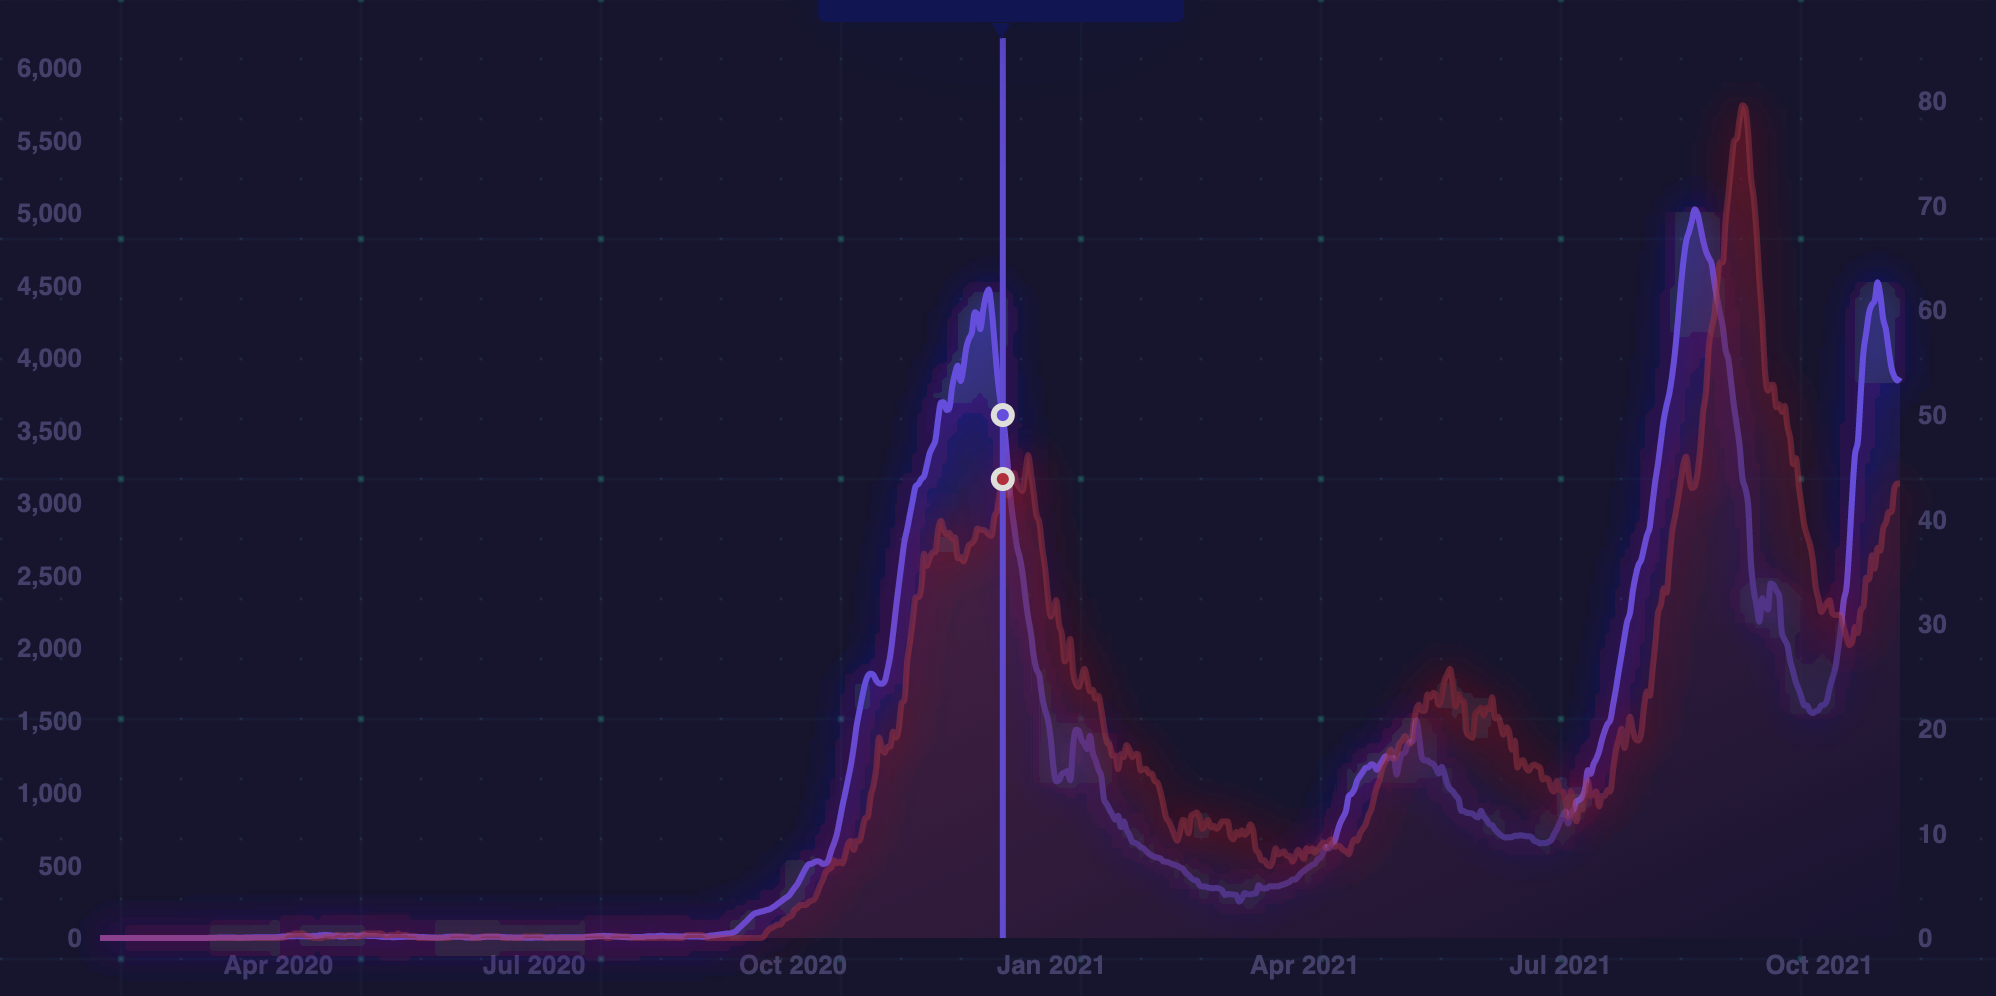
Covid-19 new cases and deaths line and area chart.
The graph is linked to the online data and updates on a daily basis.
The customized visualization lets the user select the country of interest, filter the data for different periods (week, month, year, all), and choose the moving average methodology for extrapolation.